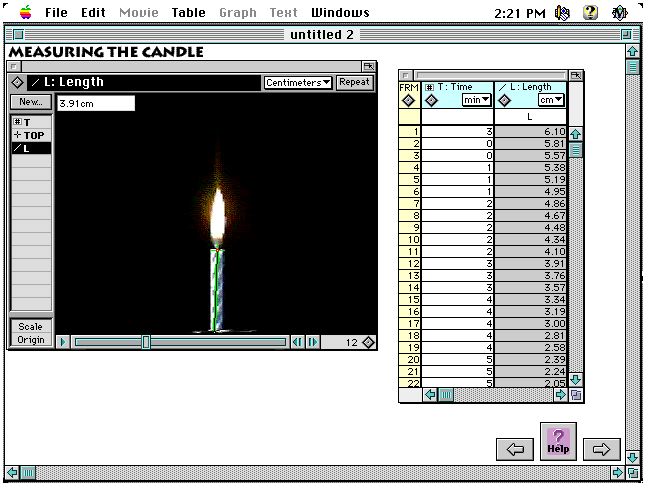
Students can click on a point on the table and see the candle burning at the point in time
by David Geronemo
SUBJECT AREA: Math: Problem Solving and Reasoning, Analysis of Measurements of Dynamic Systems (those which change over time), Graphing Linear and Non-linear Relationships, and Formulating Hypotheses About the Relationships Between Distance, Time and Speed of a Changing Phenomena.
PUBLISHER: Learning In Motion (800)560-5670
GRADE LEVEL: High School
NOTABLE HARDWARE REQUIREMENTS: Mac only: System 7.0 or greater, Minimum 2 MB RAM, 4X CD-ROM Drive
DESCRIPTION: This program contains five investigative folders which vary in their mathematical and scientific level. A problem is stated for each of the five activities and directions are given for solving the problem. The activities vary along the continuum from being highly directive to somewhat open-ended. The first activity, the Candle, is designed to teach students how to use the program and includes step by step directions for solving the problem. The investigation is based on a time lapse movie of a burning birthday candle. Students begin by predicting what a graph of the candle's graph would look like over time. They then graph measurements from the movie, compare their results with their original prediction, and extend their learning to hypothetical situations, such as a candle that burns more quickly at first, then slows down and vice versa.
Students can click on a point on the table and see the candle burning at that point in time. Each succeeding investigation becomes more complex. For example, the third investigation is based on a movie of an amusement park ride called the Typhoon which carries its passengers in a large circle and is partially counterbalanced at one end. Students are asked to predict where riders spend most of their time, near the top or near the bottom, and at what point the car travels the fastest. Using different kinds of graphs (histogram, line graph, bar graph, scattergram, etc.) students observe the car's motion and test their hypotheses. The last investigation is the most complex. It is based on a movie of a truck rolling down the highway. Students are first asked to predict where they think the vanishing point will be (the place where the truck, the road and the rest of the cars converge to a single point on a line). To test their prediction students are able to plot x and y coordinates on the video and make a graph of those points versus the width of the truck. Students find the exact vanishing point by determining the coordinates at which the truck's width is zero.
STRENGTHS: Measurement in Motion cleverly uses the computer's capabilities to teach the complex process of making hypotheses and taking and analyzing data. It is easy to use and is designed so that the introductory activities teach students how to proceed. An exciting feature is that, with the addition of a video camera and video capture board, students can shoot their own movies and use them with the program. They can take and analyze different measurements from the home video using the wide variety of graphs and tables provided in the program. Teachers, too, can make use of this feature and develop authentic activities for students to work on independently or in groups.
SUMMARY: Measurement in Motion provides an innovative way of teaching students to take measurements, develop graphs, and analyze their data. The ability to create new videos to add to the program extends its scope and increases its relevance for students.
David Geronemo is a graduate student in the Department of Special Education at The College of New Jersey.